Introduction To Candlesticks

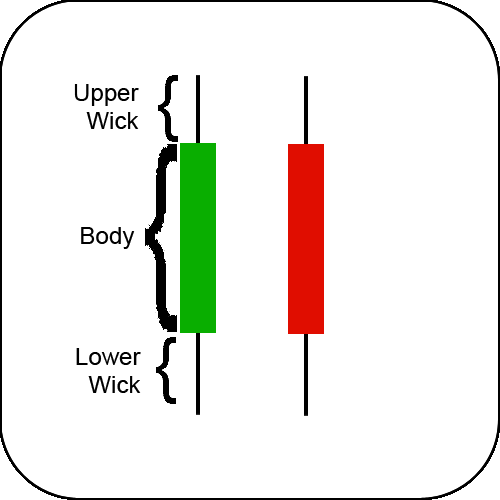
Candlesticks are a way to capture price data (or any data for that matter - but we'll stick to price) as long as you are given an open, high, low, and close value for each time period. Candlesticks are composed of 3 parts:
- The body or real body
- The upper shadow or upper wick
- The lower shadow or lower wick
The Candlestick Body
The first part of the candlestick we'll discuss is the body, or real body. The body, the meat, of a candlestick is formed between the open and the close of the time period represented by a single candle. If the price opens low and closes higher, we have a positive close on the time, and the candlestick will be green. Just a note - the colors are completely arbitrary. On this site, we use green for up and red for down. It doesn't really mean anything, the colors could be white for up and black for down, or gold for up and purple for down. Here - it will be green and red. A green real body means the close was higher than the open, while a red real body means the close was lower than the open.
The Candlestick Upper Shadow or Upper Wick
The upper wick of a candlestick is comprised of the difference between the higher of the open and close, and the high of the day. It is indicated simply by a line coming out of the middle of the top of the real body of the candle. It has no color, but it still contains important information that is used as we explore the various candlestick formations some of which give us entry and/or exit signals..
The Candlestick Lower Shadow or Lower Wick
The lower wick, as you can probably surmise, is comprise of the difference between the lower of the open and close, and the low of the day. As the upper shadow, it is indicated simply by a line coming out of the middle of the bottom of the real body of teh candle. And again, while it has no color, it still contains important information that is used as we explore the various candlestick formations some of which give us entry and/or exit signals.
Candlestick Charts
A candlestick chart is formed as we plot out our individual candlesticks for a given period of time, over a given period of time. Think in terms of plotting the daily candlestick print for each day, over the course of a year. Each day you add a new candlestick, representing the price action for that day, until you have a candlesick chart which contains a year worth of daily data.
Candlestick Formations
There are dozens of popular candlestick formations, and hundreds of underground formations, that are recognized by candlestick users. These formations are defined by, and composed of 1 or more individual candlesticks interacting in a certain way. In the large candlestick listing page, we list some of the various candlesticks patterns and include link to individual pages where each candlestick formation is discussed. For the purposes of a basic introduction to candles, just realize that each candlestick pattern, or formation, is uniquely defined. Also keep in mind that you can have more than one pattern show up at the exact same time on your candlestick chart.
Intro To Candlesticks Conclusion
And there you have it! Candlesticks are easy and in my humble opinion offer more price information at a glance than do line charts or bar charts. Now, go check out the complete candlestick listing to get an idea of which candlestick patterns are worth your time, and also when it is best to take the trade.